Kulvir Singh1,2, Swinderpal Singh1, Ginjinder Kaur1, Kaushik Bose3
1. Department of Human Genetics, Punjabi University, Patiala- 147002, Punjab, India.
2. Department of Physiology, Desh Bhagat Dental College and Hospital, Desh Bhagat University,
Mandi Gobindgarh- 147303,Punjab, India.
3. Department of Anthropology, Vidyasagar University, Midnapore – 721102, West Bengal, India.
Corresponding to: Kaushik Bose, Department of Anthropology, Vidyasagar University, Midnapore – 721 102, West Bengal,India, e-mail: kaushikbose@cantab.net
Care Weekly 2019;
Published online September 1 6, 2019, http://dx.doi.org/10.14283/cw.2019.5
Abstract
Objective: To use mid upper arm circumference (MUAC) as a proxy measure of undernutrition in elderly males of Punjab, India.
Design and measurements: Male participants in old age homes (n=215) and community based (n=239) were measured for standing height, weight and mid upper arm circumference (MUAC) during … from different areas of Punjab. Chronic energy deficiency (CED) was determined using the WHO international guidelines as BMI<18.5 kg/m2 and normal as BMI≥18.5 kg/m2. Descriptive statistics and percentiles were calculated and multiple linear regression analysis was undertaken to assess the associations between age, MUAC and BMI. Receiver-operating characteristic curve (ROC) analysis was performed to determine the best MUAC cut-off values to identify CED status. The χ2 test was used to assess significance of the difference in CED prevalence across MUAC categories.
Setting: Old age homes and selected community based elderly of Punjab State, India.
Participants: Elderly males in old age homes (n=215) and community based (n=239) were chosen after obtaining the informed consent. Results: MUAC cut-off value of 22.9 cm among the elderly in old age home and 23.4 cm among the community based elderly were the best cut-off points to differentiate between CED and non-CED individuals.
Conclusions: The present study proposes the MUAC of 23.5 cm to differentiate between CED and non-CED male elderly individuals. There is a greater need to establish statistically appropriate MUAC cutoff values to predict undernutrition and morbidity in elderly across different ethnic groups.
Keywords: Mid upper arm circumference, body mass index, chronic energy deficiency, elderly, old age home.
Introduction
The proportion of the elderly section is rising in India (1, 2) who are more prone to poor health conditions. Undernutrition is one of the major conditions in elderly, associated with the increased risk of mortality, morbidity, frailty, declining in physical functions and mental health problems (3-8). The opposite could also be true, that physical and mental health illness leads to loss of appetite and undernutrition (9). The intake of energy equals the output of energy in living organisms in stable body weight situations (10).There seems to be an extremely efficient regulatory system that helps maintaining the stability of the amount of fat in the body (stored energy) and is usually termed as ‘energy homeostasis’ (10). Insulin and leptin are two major hormones, which help in regulating the fat storage in body (11-13). Optimal nutrition is essential for good physical and mental health. However, the consumption of food varies from individual to individual. Overnutrition results in greater fat storage and manifested as increased weight and size of the body. On the other hand, undernutrition causes the loss of fat storage, which results in thinness among the adults and, stunting and wasting among the children. In elderly, undernutrition is of greater concern, as it has greater association with morbidity and mortality as compared to obesity(14-16).
The use of anthropometry to assess the body size and composition is well established. Anthropometric measurements are the reliable indicators of nutrition and health status of the individual(17). The WHO recommended the use of BMI (≤18.5 kg/m2) calculated from height and weight as an indicator of under nutrition and adiposity at all ages(17,18). Among the elderly individuals BMI predicted under nutrition is associated with quality of life, mortality, cognitive and self rated health(19-20). Incidence of spinal deformities(21),physical dysfunction and frailty(22) was higher in the elderly individuals as compared to the younger peer. Given these practical issues, recording height and weight measurements on elderly individuals is not always possible. Hence, the use of BMI for screening under nutrition among elderly is limited(23). There is a greater possibility that those older individuals, which could not be measured properly, would be left out or are incorrectly measured(24-26).
The MUAC is another simpler anthropometric measurement that can be used as an indicator of nutritionand health status among the adults and elderly individuals(15,27,28).It is highly associated with morbidity and mortality among the elderly residing in old age care facilities(26,29,30) as well as among community dwelling elderly population (31-33).Use of MUAC as an indicator of nutritional status among adolescents and adults is well documented (34) and is also used in establishing an optimal MUAC cut-off (35). To conduct MUAC measurement, the circumference of the upper arm at the mid point of the tip of olecranon and the tip of acromion processes is measured using a standardized tape. The MUAC measurement can be easily obtained on the individuals who cannot sit or stand properly. Bed ridden and older participants not able to stand erect for height measurements can’t be studied for BMI but can conveniently be measured for MUAC to assess the nutritional status. The correlation between BMI and MUAC has been well established by different studies conducted among different ethnic groups (27, 36, 37).
Regular screening of undernutriton among elderly is desirable to reverse the effect of undernutrition and consequent weight loss among older individuals (38-40). To offset the negative energy balance caused by lower intake of energy in the past by an increased intake of energy later on seems unlikely among elderly (41). Due to sarcopenia in older ages, after the weight loss it is difficult to regain proportional skeletal muscle mass during weight gain (42-44). Among the older individuals, decline in physical mobility and cognitive skills (45) make them dependent on others (family members or health care providers) for their health care. Therefore, we need a tool that is inexpensive, quick, has least instrumentation, require least technical skills and can be applied in field setting. The family members can use such a tool with ease and health care providers in old age care facilities can apply such tool quickly, on large number of individuals.
The present study attempts to use mid upper arm circumference (MUAC) as a proxy measure of undernutrition in elderly males of Punjab, India.
Method and materials
Participants and setting
In the present cross-sectional study, Anthropometric data of 454 male participants aged 60 years and above (215 old age home based and 239community based) were collected cross-sectionally from six districts of Punjab, India, includingAmritsar, Barnala, Ferozpur, Jalandhar, Patiala and Sangrur during year 2012 to 2014. The management and caretaking authorities of the old age homes visited were informed about the objective of the research and written informed consent was obtained from them and from each subject. In total 21 old age homes were visited during sample collection. All the old age homes were maintained by non-governmental organizations or single private individuals. The elderly who were able to stand erect for height measurements and not suffering from any visible disability were included in the study. No statistical sampling technique could be applied given the limited number of elderly in old age homes and also by obtaining the informed consent(46). All the elderly residing in old age homes from at least 5 years were included in the study. As the old age homes draw their inmates from their adjoining areas, therefore the samples for community based elderly were obtained by visiting home to home, from adjoining areas to the old age homes to maintain homogeneity between both the study groups. Each subject along with family members were informed about the objective of the study and written informed consent was obtained from them. Ethical clearance had been obtained from Institution Clinical Ethical Committee, Punjabi University, Patiala, Punjab, India (Letter number: 427/DIS; Dated: 27/11/2012; ICED clearance number: ICEC 57).
Socio economic status
The information regarding the education level, personal source of income, marital status and number of children was obtained for both the groups of elderly to elucidate social and economic conditions. For the community based elderly, the information about whether they were living with son/sons, daughter or only with their spouse was recorded. The duration of the total stay in old age home was recorded (in years) for the old age home based elderly participants. Educational level was recorded as the standard of class for which examination is passed by the individual. The following educational categories were made: uneducated (not able to read and write, including below the third standard), up to matric (from the third up to the tenth standard), and higher education(eleventh standard and above).The income from personal sources included incomes received directly by the elderly, but not from any of their family members and children. The pensions obtained from government’s old age pension schemes being very paltry was not considered as an income source. The marital status was categorized as: married, unmarried (never married) and widowed or separated (lost their spouse by death or divorce). The information about number of living children was stratified into three categories: none (no child), up to three children and more than three children.
Anthropometry and nutritional status
The anthropometric measurements were obtained following the standard methodology(47).Height was recordedup to the nearest millimeter. Only those participants who were able to stand erect were included in the study. Participants were asked to stretch as much as possible. The head was held so that Frankfort plane becomes horizontal. Height and MUAC were recorded to the nearest millimeter and weight to the nearest 100 g. BMI was computed as weight in kilograms divided by the square of height in meters. Nutritional status was determined using the WHO international guidelines (WHO, 1995) (17) as: CED (BMI < 18.5kg/m2), normal (BMI = 18.5–24.9 kg/m2), overweight(BMI = 25.0–29.9 kg/m2) and obese (BMI ≥ 30.0 kg/m2); as well as with the Asia Pacific guidelines (WHO, 200018) as: CED(BMI < 18.5 kg/m2), normal (BMI = 18.5–22.9 kg/m2),overweight (BMI = 23.0–24.9 kg/m2) and obese (BMI ≥25.0 kg/m2).
Statistical analyses
Descriptive statistics of mean, SD and 25th, 50th and 75thpercentile values were calculated to describe the characteristics of the sample. Association between age, MUAC and BMI was analyzed by multiple linear regression analysis. Receiver-operating characteristic (ROC) curve analysis was performed to determine the optimal MUAC cut-off point to differentiate between CED (BMI< 18.5)and non-CED (BMI≥ 18.5). Sensitivity (SENS), specificity (SPEC), positive predictive value (PPV) and negative predictive value (NPV) were computed to identify these cut-off points in both the groups of elderly males elderly, respectively. Among old age home based and community-based elderly, three groups for each were created based on the ROC curve results: MUAC < 23.0 cm, MUAC= 23.0–24.9 cm andMUAC ≥ 25.0 cm for old age home based elderly; and MUAC<23.5 cm, MUAC = 23.5–25.49 cm and MUAC≥ 25.50 cm for community based elderly. Contingency χ2 tests were used to study the relationships between these MUAC groups and CED categories. All statistical analyses were performed using the SPSS version16 and MedCalc statistical software packages.
Results
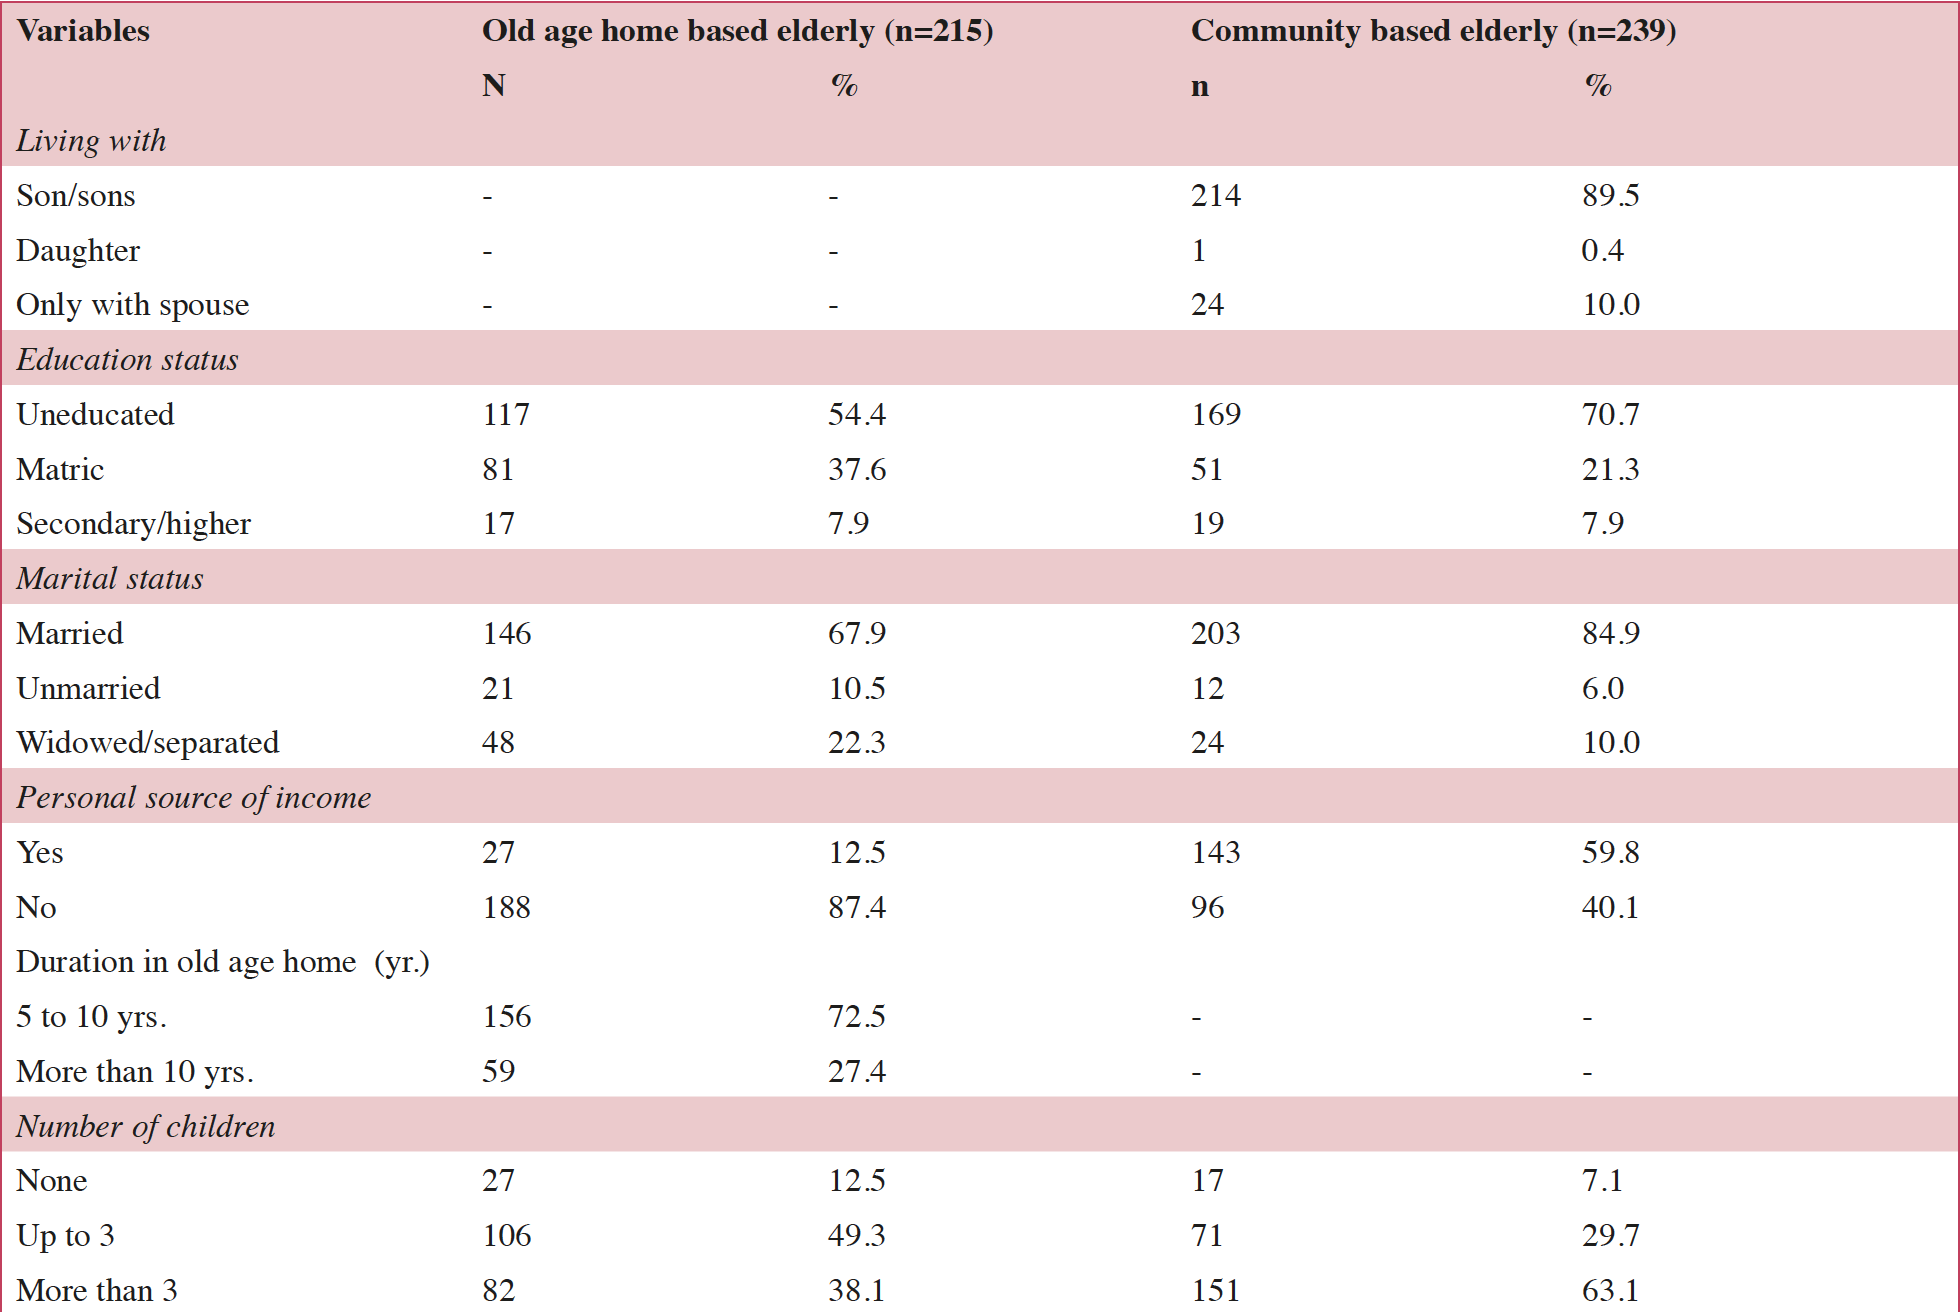
Table 1 shows the distribution of male elderly in both the study groups according to socio-economic variables. Among the community based elderly, 89.5 % of the elderly were residing with their sons, 10.0 % were residing only with spouse and only 0.4 % were residing with their daughters. Literacy rate was 45.5 percent in old age home based elderly and 29.2% in community based elderly. Among both the study groups, 7.9 % elderly had secondary or higher education status, while elderly educated up to metric standard were 37.6% and 21.3 % among old age home and community based elderly, respectively. Regarding marital status, 90.2% of the old age home based and 94.9 % of the community-based elderly were married. Of the married elderly 22.3 % of the old age home based and 10.0 % of the community based elderly lost their spouse by death or divorce. The elderly that had personal source of earning were 12.5 and 59.8 percent in old age home based and community-based elderly, respectively. For the old age home based elderly, the average duration of the stay in the old age home was 8.83 years (SD=1.75), with 72.5 % of the elderly staying in old age home from last 5 to 10 years and 27.4 % staying in old age home from more than last 10 years.
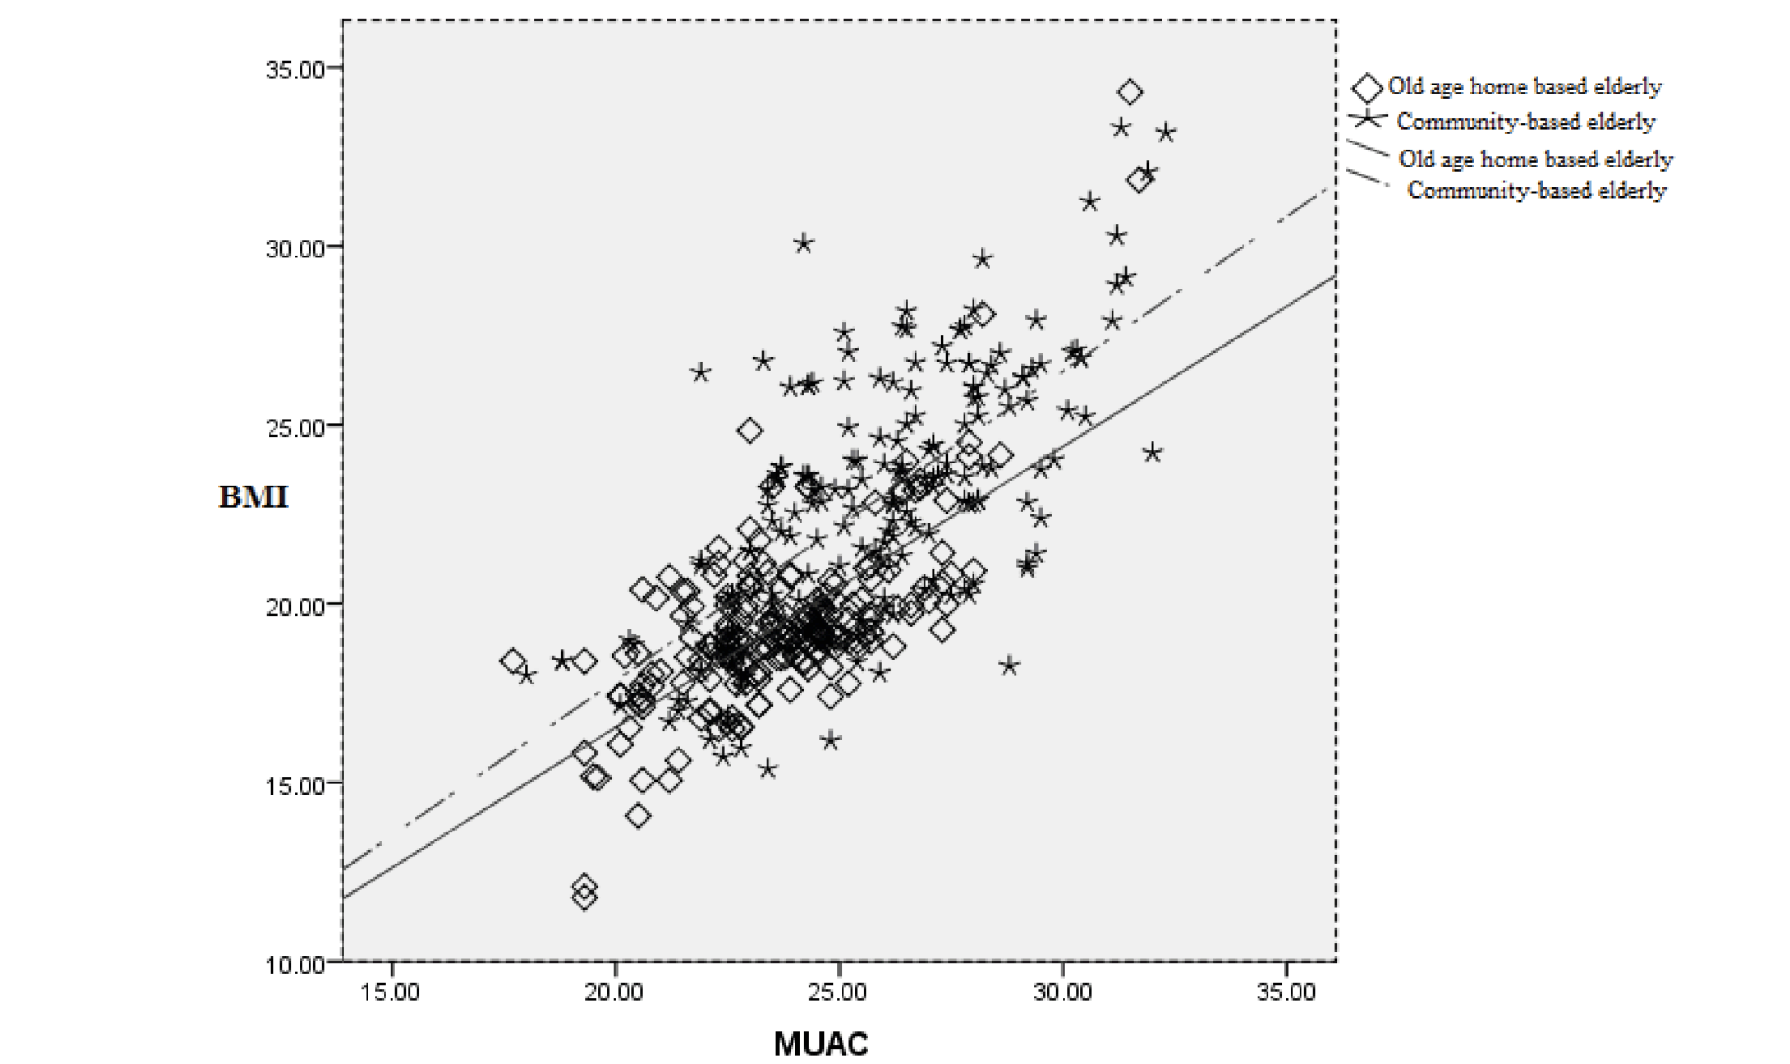
Descriptive statistics including mean, standard deviation, minimum, maximum, and 25th, 50th and 75th percentile are presented in Table 2.BMI and MUAC were highly correlated among old age home based (r=0.70) and community based elderly (r=0.68) (Figure 1). Among the elderly residing in old age homes, weight (F=9.19, p<0.001), BMI (F=6.16,p=0.003) and MUAC (F=24.509,p<0.001) decreased significantly with advancing age from 60 to greater than 80 years, while among community based elderly changes were non-significant. The mean weight (t=11.13,p<0.001), BMI (t=11.48,p<0.001) and MUAC (t=8.20,p<0.001) were significantly higher among the elderly living in home as compared to community based elderly.
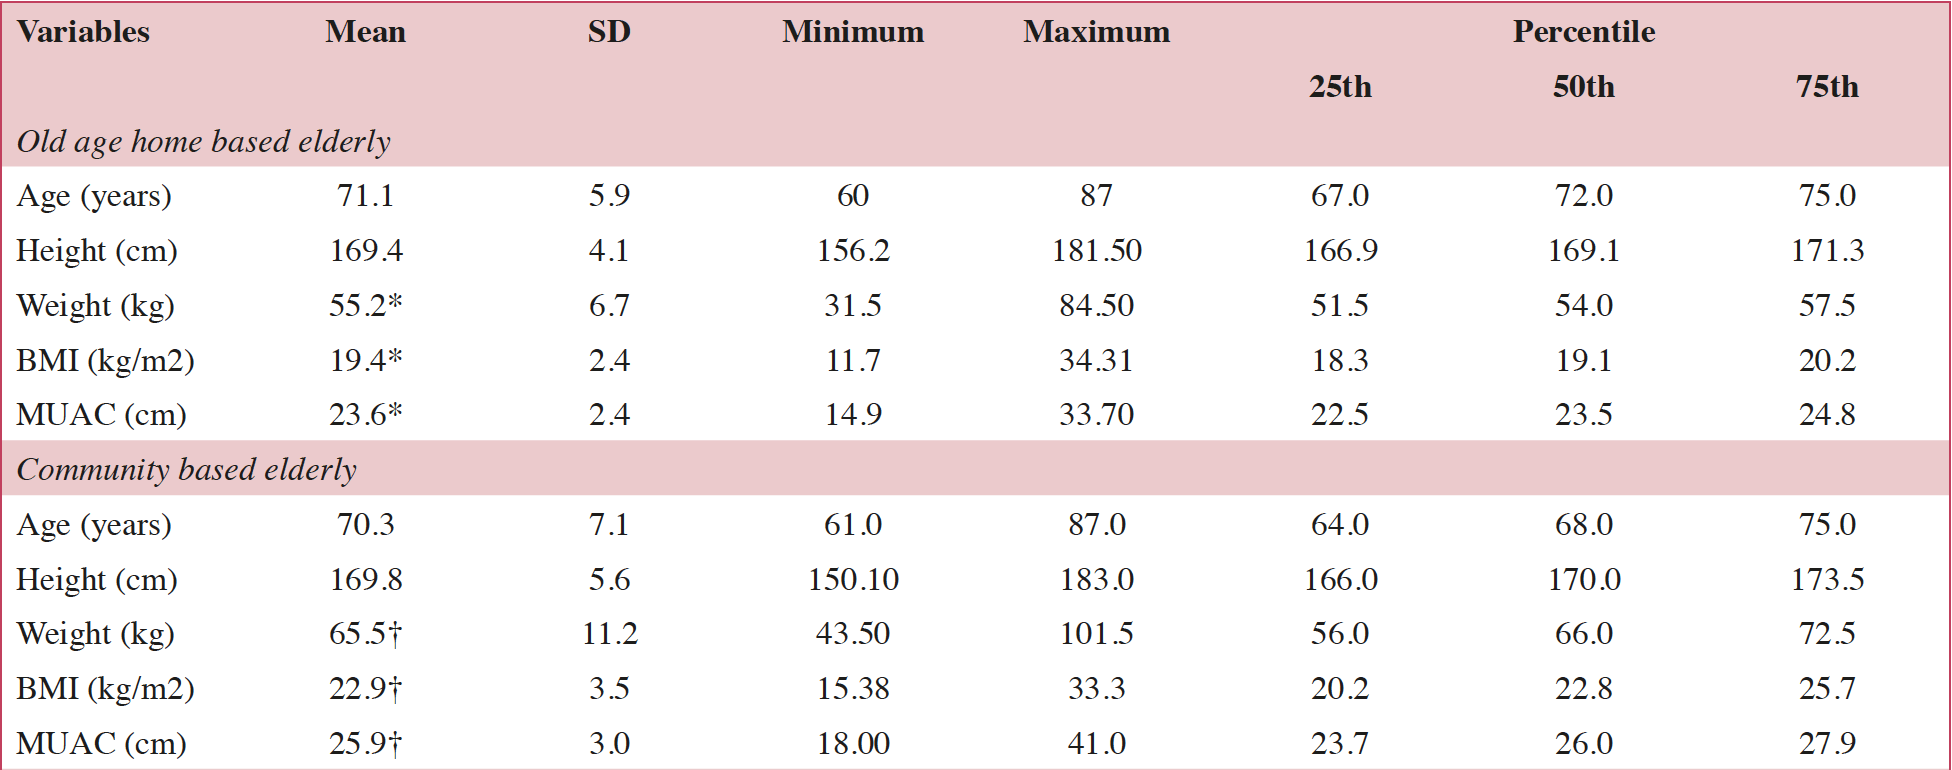
Table 2. Descriptive statistics for age and anthropometric variables among old age home and community based participants
*significantly higher among the community based elderly as compared to those living in old age homes; †Decreased significantly with advancing age from 60 to >80 years.
Table 3 presents the distribution of old age home based and community based elderly according to BMI with respect to WHO Asia Pacific guidelines and WHO international guidelines. According to the WHO’s Asia Pacific (χ2=89.14,p<0.001) and international guidelines (χ2=70.22,p<0.001) of BMI classification, there was significant difference in distribution between the old age home based and community based elderly. The percentage of the elderly in CED (BMI<18.5 kg/m2) category was 28.5 % in old age home based elderly and 10.5 % in community based elderly. According to WHO Asia Pacific guidelines for BMI classification, percentage of overweight and obese elderly was 8% among old age home based elderly and 48.5 % among community based elderly. On the other hand, according to WHO international guidelines for BMI classification, percentage of overweight and obese elderly was 1.5% among old age home based elderly and 29.5 % among community based elderly.

Table 3. Distribution of old age home based and community based elderly according to BMI with respect to WHO Asia Pacific and WHO international guidelines
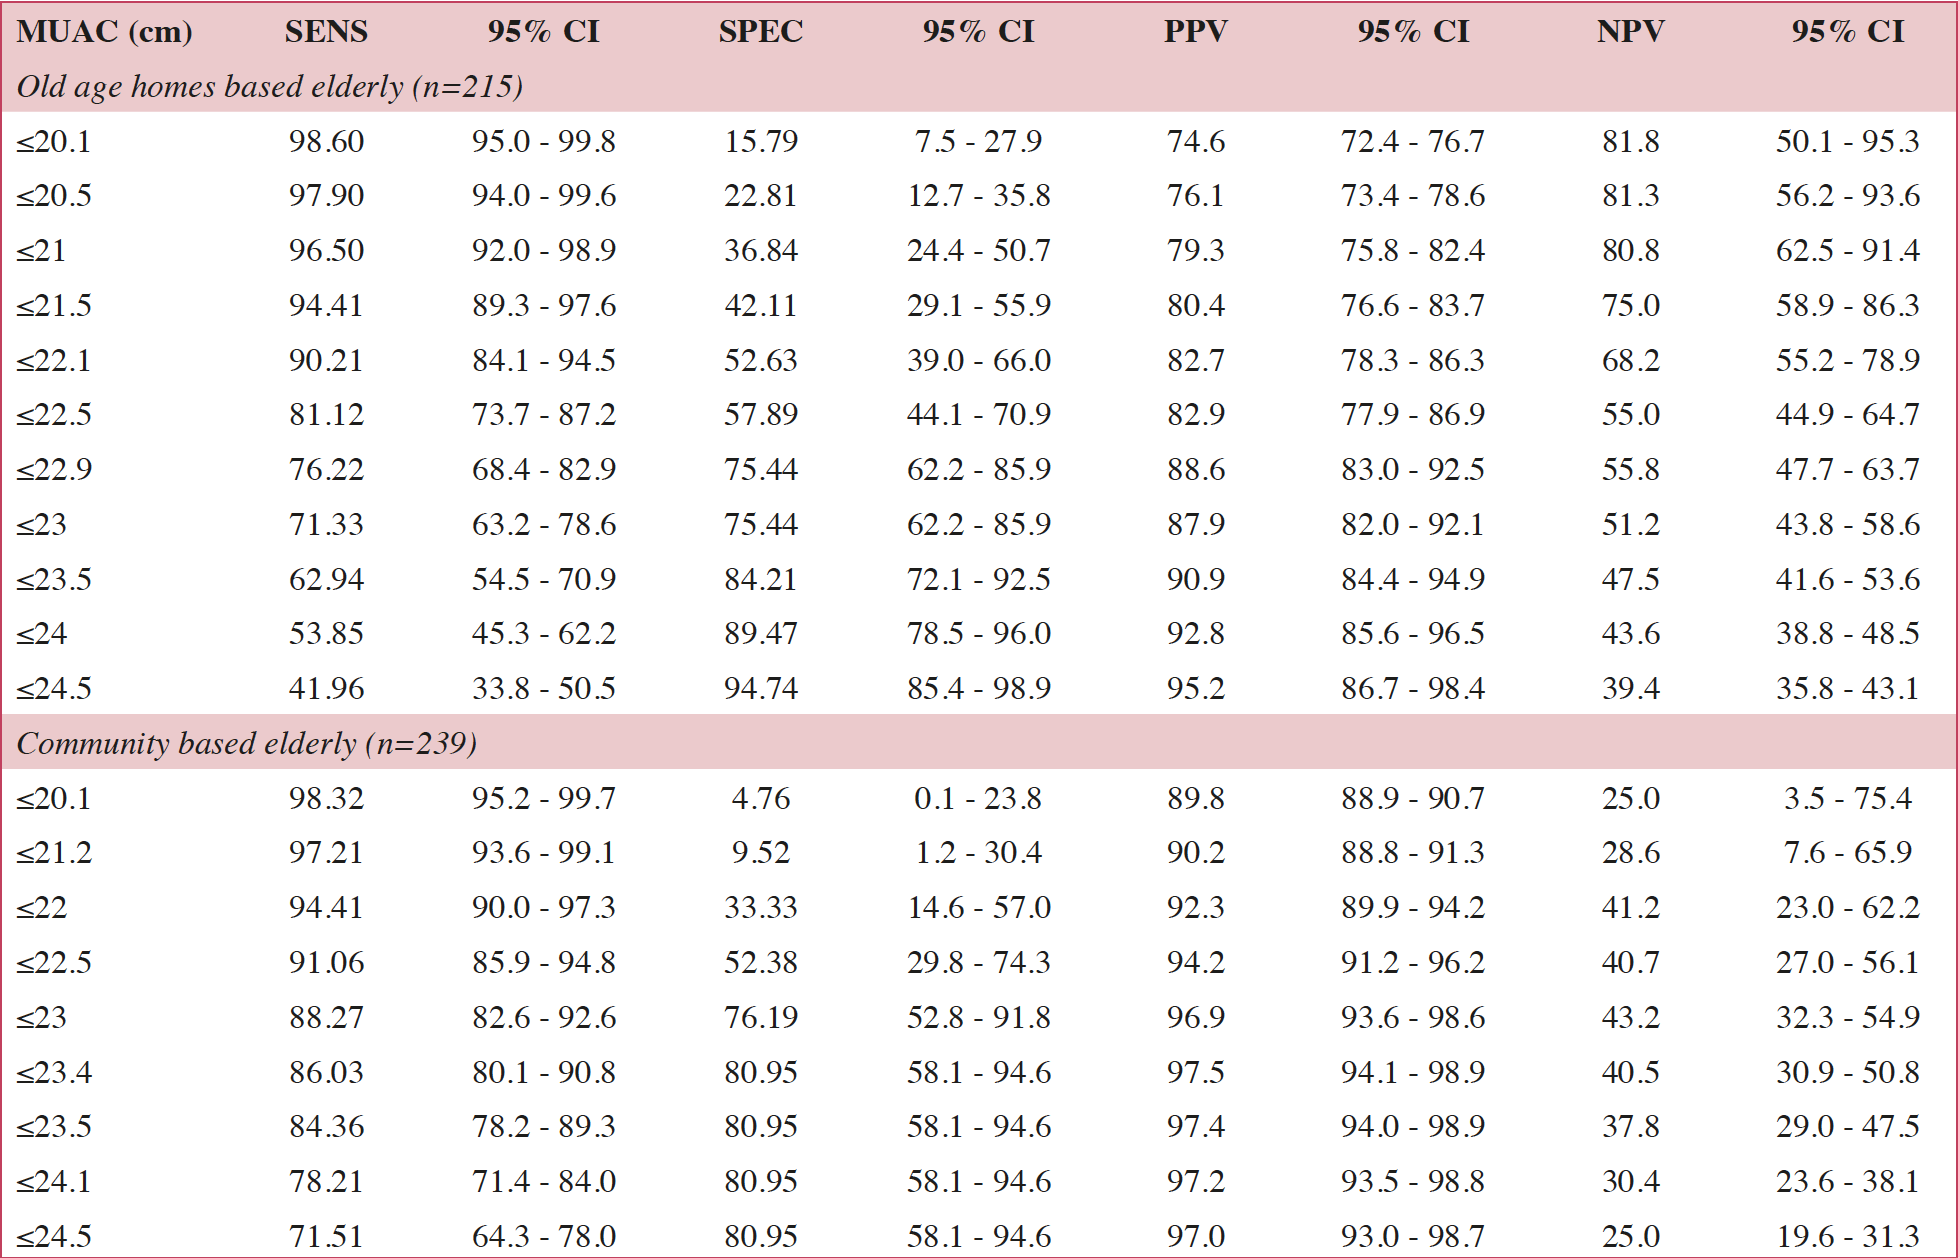
Analysis of receiver operating curve of MUAC vs. CED status (CED= BMI <18.5 kg/m2 and non-CED= BMI≥ 18.5 kg/m2) among old age home based elderly and community based elderly is presented in Table 4.For the ROC among old age home based elderly, the area under curve was 0.83 (SE 0.03, 95% CI 0.77-0.87). The Youden Index (YI)was estimated to be 0.54. The MUAC of 22.9 cm was observed to be the optimal cut-off value to differentiate between CED and non-CED elderly. The sensitivity, specificity, positive predictive value and negative predictive value were 76.22%, 75.44%, 88.6 %and 55.8 %, respectively. The ROC for old age home based elderly is presented in Figure2. For the ROC among community based elderly, the area under curve was 0.85 (SE 0.04, 95% CI 0.79-0.90). The YI was estimated to be 0.67. The MUAC of 23.4 cm was observed to be the optimal cut-off value to differentiate between CED and non-CED elderly. The sensitivity, specificity, positive predictive value and negative predictive value were 86.03%, 80.95%, 97.5 and 40.5 percent, respectively. The ROC for community-based elderly is presented in Figure 3.
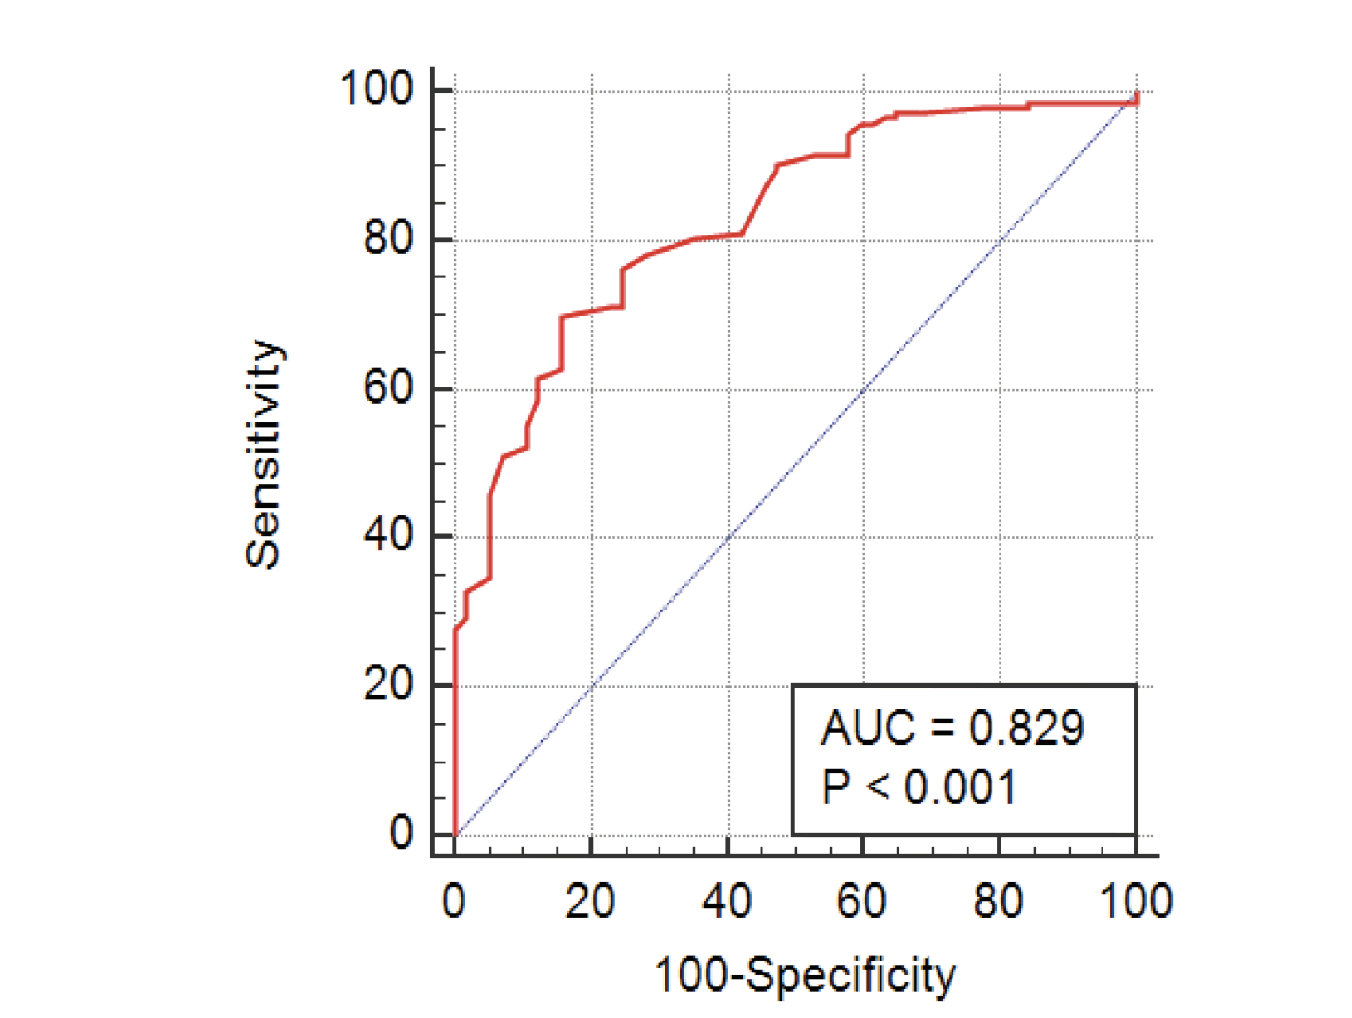
Figure 2. Receiver-operating curve of mid-upper arm circumference to determine the chronic energy deficiency status (BMI < 18.5 kg/m2) in old age home based male elderly
(bleu) plot of sensitivity v. (1 – specificity; (red) line of no discrimination.
The prevalence of CED (chronic energy deficiency) and mean BMI according to MUAC category are shown in Table 5. Among both the groups of elderly, lowest MUAC category (MUAC ≤23 cm in old age home based and ≤23.50 cm in community based elderly had highest prevalence of CED (old age home based CED 51.2%; community based CED 37.8%). The old age home based elderly with MUAC ≤23 cm had 57.51 times higher odds of CED as compared to those with MUAC ≥25 cm. In the case of community based elderly, those with MUAC ≤23.5 cm had 40.14 times higher odds of CED as compared to those with MUAC ≥25.5 cm. The prevalence of CED decreased significantly with increasing MUAC category (old age home based χ2= 39.93, p<0.001; community based χ2= 48.91, p<0.001) and the mean BMI increased significantly with increasing MUAC category (old age home based F=31.27, p<0.001; community based F= 46.28, p<0.001) among both the groups of male elderly.

Table 5. Prevalence of CED and mean BMI according to the category of MUAC among the old age home and community based elderly participants.
*Adjusted for age; †Mean BMI increased (F=31.27, p<0.001) and prevalence of chronic energy deficiency decreased(chi square = 39.93, p<0.001) with increasing MUAC category.
‡ Mean BMI increased (F=48.91, p<0.001) and prevalence of chronic energy deficiency decreased (chi square = 46.28, p<0.001) with increasing MUAC category
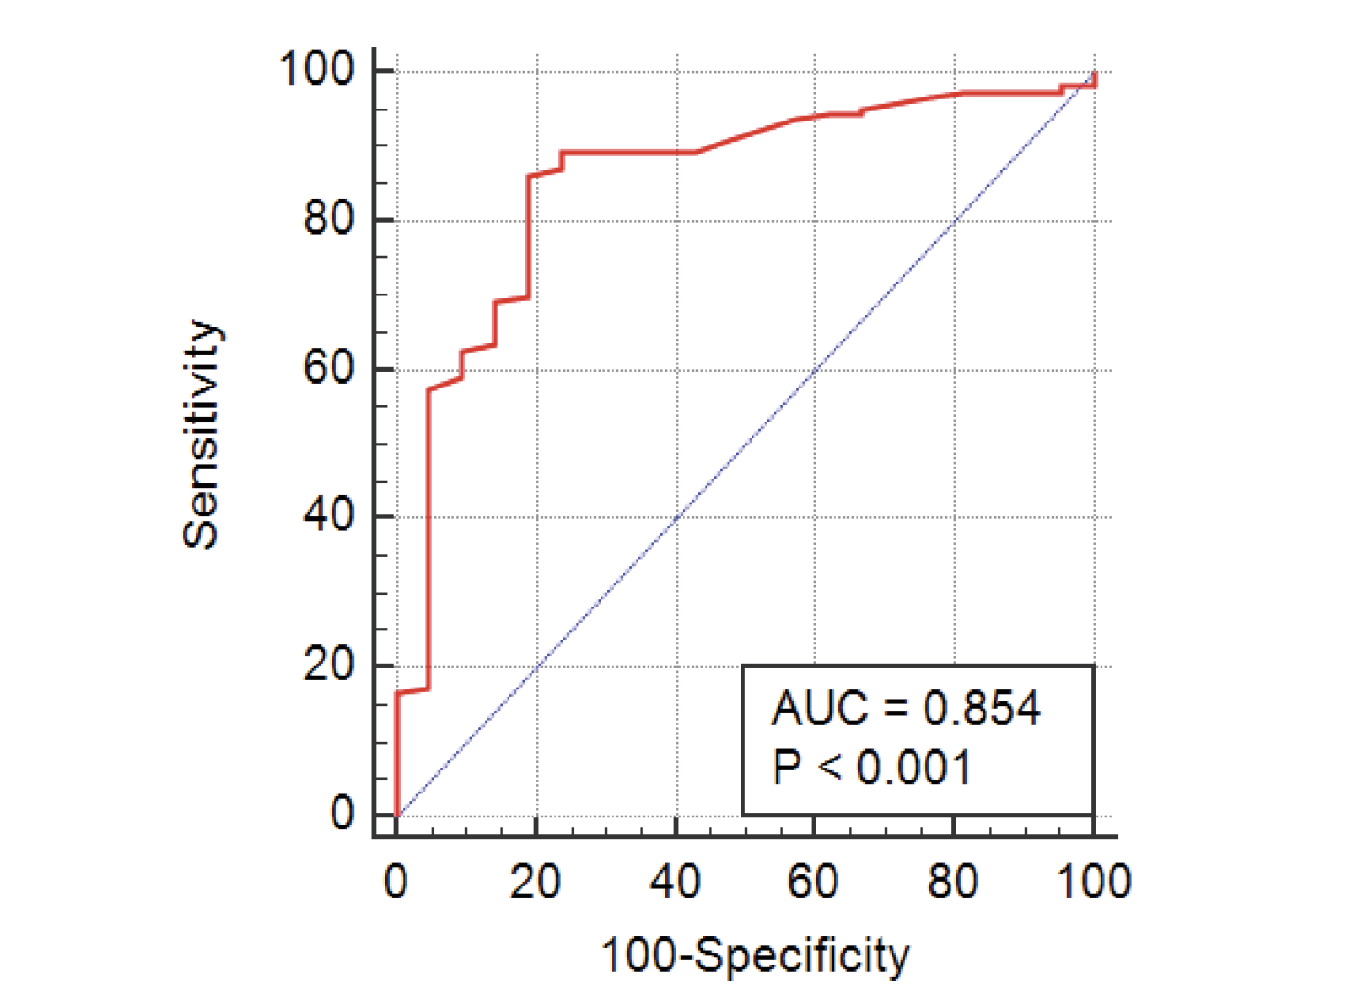
Figure 3. Receiver-operating curve of mid-upper arm circumference to determine the chronic energy deficiency status (BMI < 18.5 kg/m2) in community based male elderly
(bleu) plot of sensitivity v. (1 – specificity; (red) line of no discrimination.
Discussion
Government of India envisaged a new program intended to build new architecture for elderly care (48-50), however, at present the incidence of the public provision for the old age care is very dismal, (such as nursing homes and health insurances) (51).There is lack of organizational structure to take care of elderly in India. Some local bodies, regional institutes, national and international NGOs are maintaining old age homes in the country. Older adults in the developing countries are at higher risk of undernutrition (27, 52). In such resource limited setting with lack of professional and trained staff, MUAC may prove a better tool to assess under nutrition.The use of BMI to identify the under nutrition is well documented. However, due to the practical limitation, BMI may not be the suitable measurement for this purpose among elderly (23, 53). Recent studies conducted in older adults have recommended the use of MUAC for nutritional and health status screening (28, 54). The MUAC is well correlated with BMI to identify undernutrition among adult population(46,55-61). However, there is paucity of studies showing association between BMI and MUAC among elderly population.
In the present study, BMI was highly correlatedwith MUAC among both the groups of elderly. Findings of the present study suggested that MUAC serves as the predictor of low BMI (< 18.5 kg/m2) for screening CED elderly. Among the old age home based elderly, MUAC of <22.9 cm was observed to be the most optimal cut-off for differentiating between CED and non-CED elderly. Similarly, among the community based elderly, MUAC of <23.4 cm was observed to be the most optimal cut-off for differentiating between CED and non-CED elderly. The same cut-off was suggested by Tsai et al., (62), whoobserved that among community dwelling elderly males of Taiwan, the MUAC of <23.5 was significantly associated with the MNA (Mini Nutrition Assessment) predicted proportion of elderly at malnutrition risk. A major study conducted among adult population of five African countries, India, China and Papua New Guinea suggested MUAC of 23 cm as cut-off for screening nutritional status (63). Various studies conducted among the different ethnic (tribal) groups from India used MUAC of <23 cm as cut-off to define undernourishment among adult male (including elderly) population (57, 64).
On the other hand, Goswami et al. (53) proposed the MUAC of <25.7 cm for community based elderly men of urban region of Delhi, India. However, instead of using height to calculate BMI, they had used arm span.Chakraborty et al. (58) and Chakraborty et al. (61) proposed the MUAC of <24 cm as an optimal cut-off point for screening clinical undernourishment among themale slum dwellers of Kolkata and Oraon males of Jharkhand, India. Among Bangladeshi adults the MUAC of <25.1 cm was suggested as the optimal cut-off to detect undernutrition (65). Studies among elderly of rural Puducherry, India(53) and Haryana, India (27), concluded that MUAC (AUC=0.88, r=0.74and AUC= 0.93, r=0.88, respectively) can be used as the proxy measure to predict CED (BMI<18.5 kg/m2). However, they did not suggest MUAC cut-off value to differentiate between CED and non-CED elderly. The fact that height declines with ageing is well established (66-68). The age related loss in height was higher among institutionalized elderly as compared to community based elderly (69). The height loss with normal ageing may contribute to the increased relative weight (BMI), without similar change in upper arm composition. Therefore, in the case of elderly, a higher MUAC cut-off value than observed can be considered, particularly for old age home based elderly.In the view of these findings, it is proposed that the MUAC of 23.5 cm could be utilized as cut-off value to differentiate between CED and non-CED elderly individuals. Our study observed higher odds ratio for MUAC predicted under nutrition among old age home based elderly (OR=58.82) as compared to community based elderly (OR=40.14). Gibson (2005) (70)suggested that among individuals with lower subcutaneous fat, the MUAC predicts the body composition with greater accuracy. It has greater inverse association with all-cause mortality in non-obese individuals (71). As the older adults residing in old age homes had lower subcutaneous fat, the MUAC predicted under nutrition could be particularly more reliable among old age homes based elderly.
MUAC is a simple measure as compared to BMI. According to WHO guidelines, for children aged 6–59 months, severe acute malnutrition is defined as mid upper arm circumference <115 mm (72).These recommendations are also included in WHO program of Integrated Management of Childhood Illness (IMCI): caring for newborns and children in the community (72). However, no such recommendations to implement MUAC cut-off value for monitoring adults are included in guidelines of Integrated Management of Adolescent and Adult Illness (IMAI), which also include elderly individuals (73).This may be ascribed to non-availability of an appropriate universal MUAC cut-off for adults, and a complete dearth of data and evidence for elderly. For elderly individuals, MUAC could achieve higher rate of inclusion with greater sensitivity to identify appropriate beneficiaries having an increased health risk due to acute under nutrition. In a resource-constrained situation of developing countries, it could also facilitate the proper utilization of limited financial resources. The elderly found under nourished by MUAC can be considered for more comprehensive nutrition assessment (by an accredited practicing dietician) to identify those with complex nutritional needs (74). The automation in measurement of MUAC, to reduce manual errors could be achieved bystandardisation of photogrammetric anthropometry softwares (75).
Conclusion
The present study proposed that among community and old age home based elderly the MUAC cut-off value of 23.5 cm could be used to differentiate between CED (BMI value of <18·5 kg/m2)and non-CED individuals. Given the fact that height decline with ageing contributes to the increase in relative weight (BMI), without similar change in upper arm composition. A higher MUAC cut-off than observed can be considered, particularly for old age home based elderly. However, to conduct studies focusing on this particular problem is imperative. For elderly individuals, MUAC could achieve higher rate of inclusion with greater sensitivity to identify appropriate beneficiaries having an increased health risk due to acute under nutrition. In a resource-constrained situation of developing countries, it could also facilitate the proper utilization of limited financial resources.
Declaration
The experiments performed in this research comply with the current laws in India.
Conflicts of Interest
Authors have no conflict of interest.
Ethical standards
The ethical clearance had been obtained from Institution Clinical Ethical Committee, Punjabi University, Patiala, Punjab, India (Letter number: 427/DIS; Dated: 27/11/2012; ICED clearance number: ICEC 57).
References
1. Registrar General and Census Commissioner. Census of India, 2011. Ministry of Home Affairs, Government of India, New Delhi.
2. United nation population fund, 2013. The Status of Elderly in Punjab, 2011. Building a Knowledge Base on Population Ageing in India. New Delhi: UNPFA.
3. Kikafunda JK, Lukwago FB. Nutritional status and functionalability of the elderly aged 60 to 90 years in the Mpigi district of central Uganda. Nutrition 2005;21:59‑66.
4. Bose K, Bisai S, Das P et al. Inter‑relationshipsof income, chronic energy deficiency, morbidity and hospitalization among adult male slum dwellers of Midnapore, West Bengal, India. J Biosoc Sci 2007;39:779‑86.
5. Abellan van Kan G, Rolland YM, Morley JE et al. Frailty: towarda clinical definition. J Am Med Dir Assoc 2008;9:71–2.
6. Pednekar MS, Hakama M, Hebert JR et al. Associationof body mass index with all‑cause and cause‑specificmortality: Findings from a prospective cohort study inMumbai (Bombay), India. Int J Epidemiol 2008;37:524‑35.
7. Morley JE. Developing novel therapeutic approaches to frailty. Curr Pharm Des 2009;15:3384–95.
8. Morley JE. Undernutrition in older adults. Family Practice 2012;29:i89–i93.
9. Stratton RJ, Green CJ, Elia M, 2003. Disease Related Malnutrition: an Evidence Based Approach to Treatment. Oxford: CABI.
10. Singh SP. Anthropometric Perspective on Nutritional Status. Anthropologist Special Issue 2002;1:73-82.
11. Woods S, Lotter, E, McKay L et al. Chronic intra cerebro ventricular infusion of insulin reduces food intake and body weight of baboons. Nature 1979;282:503-505.
12. Wang J, Lieu R, Hawkins M et al. A nutrient-sensing pathway regulates leptin geneexpression in muscle and fat. Nature 1998;343:684-688.
13. Baskin D, Breininger J, Schwartz M. Leptin receptormRNA identifies a subpopulatin of neuropeptide Yneurons activated by fasting in rat hypothalamus. Diabetes 1999;48:828-833.
14. Elia M, 2003. Screening for Malnutrition: A Multidisciplinary Responsibility. Development and use of the ‘Malnutrition Universal Screening Tool’ (‘MUST’) for Adults. Worcestershire: BAPEN.
15. Kamiya K, Masuda T, Matsue Y, et al. Complementaryrole of aem circumference to body mass index in risk stratification in heart failure. Jacc: heart failure 2016;4(4):265-263.
16. Singh K, Singh SP and Kaur G. Depressive symptoms in the ageing mal population residing in old age homes and with their families in Punjab state. Ethno Med 2018;12:261-269.
17. World Health Organization, 1995 Physical Status: The Use and Interpretation of Anthropometry. Report of a WHO Expert Committee. WHO Technical Report Series no. 854. Geneva: WHO.
18. World Health Organization, 2000. The Asia Pacific Perspective: Redefining Obesity and Its Treatment. Geneva: WHO.
19. Woo J. Body mass index and mortality. Age and Ageing 2016;45:331–333.
20. Selvamani Y, Singh P. Socioeconomic patterns of underweight and its association with self-rated health, cognition and quality of life among older adults in India. PLoS ONE 2018;13:e0193979.
21. Passias PG, Poorman GW, Jalai CM et al. Morbidity of Adult Spinal Deformity Surgery in Elderly Has Declined Over Time. Spine (Phila Pa;1976) 2017;42:E978-E982.
22. Khezrian M, Myint PK, McNeil C et al. A Review of Frailty Syndrome and Its Physical, Cognitive and Emotional Domains in the Elderly. Geriatrics 2017;2:36.
23. Cook Z, Kirk S, Lawrenson S, et al. Use of BMI in the assessment of undernutrition in older subjects: reflecting on practice. Proc Nutr Soc 2005;64:313–7.
24. Bayomi DJ, Tate RB. Ability and accuracy of long-term weight recall by elderly males: the Manitoba follow-up study. Ann Epidemiol 2008;18:36–42.
25. Dahl AK, Reynolds CA. Accuracy of Recalled Body Weight – A Study with 20-years of Follow-up. Obesity (Silver Spring) 2013;21:1293–1298.
26. Weng CH, Tien CP, Li CI et al. Mid upper arm circumference, calf circumference and mortality in Chinese long-term care facility residents:a prospective cohort study. BMJ open 2018;8:e020485.
27. Jamir L, Kalaivani M, Nongkynrih B et al. Anthropometric Characteristics and Undernutrition Among Older Persons in a Rural Area of Northern India. Asia Pac J Public Health 2015;27:NP2246-58.
28. Schaap LA, Quirke T, Wijnhoven HAH et al. Changes in body mass index and mid-upper arm circumference in relation to all-cause mortality in older adults. Clin Nutr 2018;37:2252-2259.
29. Allard JP, Aghdassi E, Mcarthur M et al. Nutrition risk factors for survival in the elderly living in Canadian long-term care facilities. J Am Geriatr Soc 2004;52:59–65.
30. Sagawa M, Kojimahara N, Otsuka N et al. Immune response to influenza vaccine in the elderly: association with nutritional and physical status. Geriatrics & Gerontology International 2011;11:63–8.
31. Chen Y, Ge W, Parvez F et al. A prospective study of arm circumference and risk of death in Bangladesh. International Journal of Epidemiology 2014;43:1187–1196.
32. Yallamraju SR, Mehrotra R, Sinha A et al. Use of mid upper arm circumference for evaluation of nutritional status of OSMF patients. Journal of International Society of Preventive & Community Dentistry 2014;4:S122-5.
33. Wijnhoven HAH, Schilp J, van Bokhorst-de van der Schueren et al. Development and Validation of Criteria for Determining Undernutrition in Community-Dwelling Older Men and Women: The Short Nutritional Assessment Questionnaire 65+. Clinical Nutrition 2012;31:351–8.
34. Tang AM, Kimberly D, Megan D et al. Use of Cutoffs for Mid-Upper Arm Circumference (MUAC) as an Indicator or Predictor of Nutritional and Health-Related Outcomes in Adolescents and Adults: A Systematic Review. Washington, DC: FHI 360/FANTA, 2013.
35. Tang AM, Chung M, Dong K et al. Determining a Global Mid-Upper Arm Circumference Cutoff to Assess Underweight in Adults (Men and Nonpregnant Women).Washington, DC: FHI 360/FANTA, 2017.
36. Bisai S, Bose K. Undernutrition in the Kora Mudi tribal population, West Bengal, India: a comparison of body mass index and mid-upper-arm circumference. Food and Nutrition Bulletin 2009;30:63-68.
37. Ghosh M, Bose K. Assessment of undernutrition among male Bhumijs of West Bengal, India: A comparison of body mass index and mid-upper arm circumference. Human Biology Review 2015;4:140-149.
38. Miller SL, Wolfe RR. The danger of weight loss in theelderly. J Nutr Health Aging 2008;12:487–91.
39. Chapman IM. Weight loss in older persons. Med ClinNorth Am 2011;95:579–93.
40. Flanagan D, Fisher T, Murray M et al. Managing undernutrition in the elderly – prevention is better than cure.Aust Fam Physician 2012;41:695-9.
41. Roberts SB (2000) Regulation of energy intake in relation tometabolic state and nutritional status. Eur J Clin Nutr 2000;54(3):S64–9.
42. Newman AB, Lee JS, Visser M, et al. Weight changeand the conservation of lean mass in old age: the Health Aging and Body Composition Study. Am J ClinNutr 2005;82:872–8.
43. Delmonico MJ, Harris TB, Visser M, et al. Longitudinal study of muscle strength, quality, and adipose tissue infiltration. Am J Clin Nutr 2009;90:1579-85.
44. Lee JS, Visser M, Tylavsky FA, et al. Weight loss andregain and effects on body composition: the Health, Aging, and Body Composition Study. J Gerontol A BiolSci Med Sci 2010;65:78–83.
45. Harada CN, Natelson Love MC, Triebel KL. Normal cognitive aging. Clin Geriatr Med 2013;29:737-52.
46. Das P, Khatun A, Bose K et al. The validity of mid-upper arm circumference as an indicator of low BMI in population screening for undernutrition: a study among adult slum dwellers in eastern India. Public Health Nutr 2018;14:2575-2583.
47. Lohman TG, Roche AF, Martorell R. AnthropometricStandardization Reference Manual. Chicago, IL: HumanKinetics Books, 1988.
48. National Programme for the Health Care of the Elderly. An approach towards active and healthy ageing. Government of India. Directorate General of Health Services, Ministry of Health and Family Welfare, New Delhi, 2011.
49. Integrated Programme for Older Persons. A Central Sector Scheme to improve the quality of life of the Older Persons (Revised as on 01.04.2016). Government of India. Ministry of Social Justice & Empowerment. New Delhi, 2016.
50. United Nations Population Fund . Caring for Our Elders: Early Responses- India Ageing Report –2017. New Delhi: UNFPA, 2017.
51. Verma R, Khanna P. National Program of Health-Care for the Elderly in India: A Hope for Healthy Ageing. International Journal of Preventive Medicine 2013;4:1103–1107.
52. Kshetrimayum N, Reddy CV, Siddhana S et al. Oral health-related quality of life and nutritional status of institutionalized elderly population aged 60 years and above in Mysore City, India. Gerodontology 2013;30:119–25.
53. Goswami AK, Kalaivani M, Gupta SK et al. Usefulness of Mid-Upper Arm Circumference in Assessment of Nutritional Status of Elderly Persons in Urban India. Int J Med. Public Health 2018;8:34-37.
54. Selvaraj K, Jayalakshmy R, Yousuf A et al. Can mid-upper arm circumference and calf circumference be the proxy measures to detect undernutrition among elderly? Findings of a community-based survey in rural Puducherry, India. J Family Med Prim Care 2017;6:356-9.
55. Bose K. Generalised obesity and regional adiposity in adult white and migrant Muslim males from Pakistan in Peterborough. J R Soc Health Promot 1996;116:161–167.
56. Collins S. Using middle upper arm circumference to assess severe adult malnutrition during famine. JAMA 1996;276:391–395.
57. Bose K, Bisai S, Das P et al. Relationship of income with anthropometric indicators of chronic energy deficiency among adult female slum dwellers of Midnapore town. J Hum Ecol 2007;22:171–176.
58. Chakraborty R, Bose K, Bisai S. Mid-upper arm circumference as a measure of nutritional status among adult Bengaleemale slum dwellers of Kolkata, India: relationship with self reported morbidity. Anthropologischer Anzeiger, Jahrg 2009;67:129-137
59. Martin AC, Pascoe EM, Forbes DA et al. Monitoring nutritional status accurately and reliably in adolescents with anorexia nervosa. J Paediatr Child Health 2009;45:53–57.
60. Mazicioglu MM, Yalcin BM, Ozturk A. Anthropometric risk factors for elevated blood pressure in adolescents in Turkey aged 11–17. Pediatr Nephrol 2010;25:2327–2334.
61. Chakraborty R, Bose K, Koziel S. Use of mid-upper arm circumference in determining undernutrition and illness in rural adult Oraon men of Gumla District, Jharkhand, India. Rural and Remote Health 2011;11:1754.
62. Tsai AC, Chang TL, Yang TW et al. A modified mini nutritional assessment without BMI predicts nutritional status of community-living elderly in Taiwan. J Nutr Health Aging 2010;14(3):183-9.
63. James WP, Mascie-Taylor GC, Norgan NG et al. The value of arm circumference measurements in assessing chronic energy deficiency in Third World adults. Eur J Clin Nutr 1994;48:883-94
64. Bose K, Chakraborty F, Mitra K et al. Nutritional status of adult Santal men in Keonjhar District, Orissa, India. Food and Nutrition Bulletin 2006;27:353-356.
65. Sultana T, Karim N, Ahmed T et al. Assessment of Under Nutrition of Bangladeshi Adults Using Anthropometry: Can Body Mass Index Be Replaced by Mid-Upper-Arm-Circumference? PLoS ONE 2015;10:e0121456.
66. Sorkin JD, Muller DC, Andres R. Longi¬tudinal change in height of men and wom¬en: Implications for interpretation of the body mass index: The Baltimore Longi¬tudinal Study of Ageing. Am J Epidemiol 1999;150:969–77.
67. Bagga A. Age changes in some linear measurements and secular trend in height in adult Indian women. Acta Biologica Szegediensis 2013;57:51–8.
68. Chmielewski P, Borysławski K, Chmielowiec K. Longitudinal and cross-sectional changes with age in selected anthropometric and physiological traits in hospitalized adults: an insight from the Polish Longitudinal Study of Aging (PLSA). Anthropological Review 2015;78:317–336.
69. Shatenstein B, Kergoat MJ, Nadon S. Anthropometric Changes Over 5 Years in Elderly Canadians by Age, Gender, and Cognitive Status. Journal of Gerontology: MEDICAL SCIENCES 2001;56A:M483–M488.
70. Gibson RS. Principles of Nutritional Assessment, 2nd ed. Oxford: Oxford University Press, 2005.
71. Wu LW, Lin YY, Kao TW et al. Mid-Arm Circumference and All-Cause, Cardiovascular, and Cancer Mortality among Obese and Non-Obese US Adults: the National Health and Nutrition Examination Survey III. Sci Rep. 2017;7:2302.
72. World Health Organization. WHO Guideline: Updates on the management of severe acute malnutrition in infants and children. Geneva: WHO, 2013.
73. World Health Organization. International Working Group Meeting onIntegrated management of adolescent and adult illness (IMAI). Geneva: WHO, 2003.
74. Australian and New Zealand Society for GeriatricMedicine. Under-nutrition and the older person. Position statement no. 6. Sydney: ANZSGM, 2007.
75. Liu Y, Sowmya A, Khamis H. Single camera multi-view anthropometric measurement of human height and mid-upper arm circumference using linear regression. PLoS ONE 2018;13(4):e0195600.

